
Using the reports, you will be able to know very useful information about your business,
evolution, profitability, best-selling services and products, forecasts and much more.
In addition to accounting/financial information: income, expenses, profit, billing broken
down by tax type, etc.
You can print the reports, organize the information in different ways, consult graphs and directly access the data of that animal, client, ...:
Selector: If you have several software or business areas, in many reports, you can select whether you want to see it for all of them or, for example, only for your Hotel.
Sort: The table titles allow you to sort by clicking on them. For example, you can sort them by date, name, state, ...
Shortcut to consult more information: If you click on the name of a client/animal/..., a new browser tab opens with the file or Magic Desk of that client
More information about search engines and sorting
Click herePrint and export: You can print and export the reports in .pdf format by clicking on the Print button in the upper right corner. You can send this .pdf file by email, copy it to a disk, save it on your device, upload it to the cloud or whatever you need.
Interactive Charts: Most reports include interactive charts. If you hover over the graph, you will see expanded information for each data partition.
Date range: If when selecting the dates, the system displays an Error message, it is because the date range is not correct. If you select a correct range, you will be able to generate the report:
The difference between the dates (start date and end date) cannot be more than 365 days
The starting date cannot be earlier than 395 days from the current date
List with all the invoices generated in the date range and for the selected apps.
This report is useful for generating accounting/submitting documentation/tax payments, as it details the data for each invoice.
If you prefer to simply check your income (the money you have earned), without the full details of the invoice, you will find the RESULTS report more useful.
DETAIL: As you know, when an output is made, the Sale or Invoice is generated. This report shows those sales or invoices that have already been made.
The information included is:
Invoice date (does not have to be the same as the payment date)
Number of invoices
The method of payment
The status: paid or pending
Customer information: name and identification document
The base amount (or without taxes), the tax percentage and the final amount (or total)
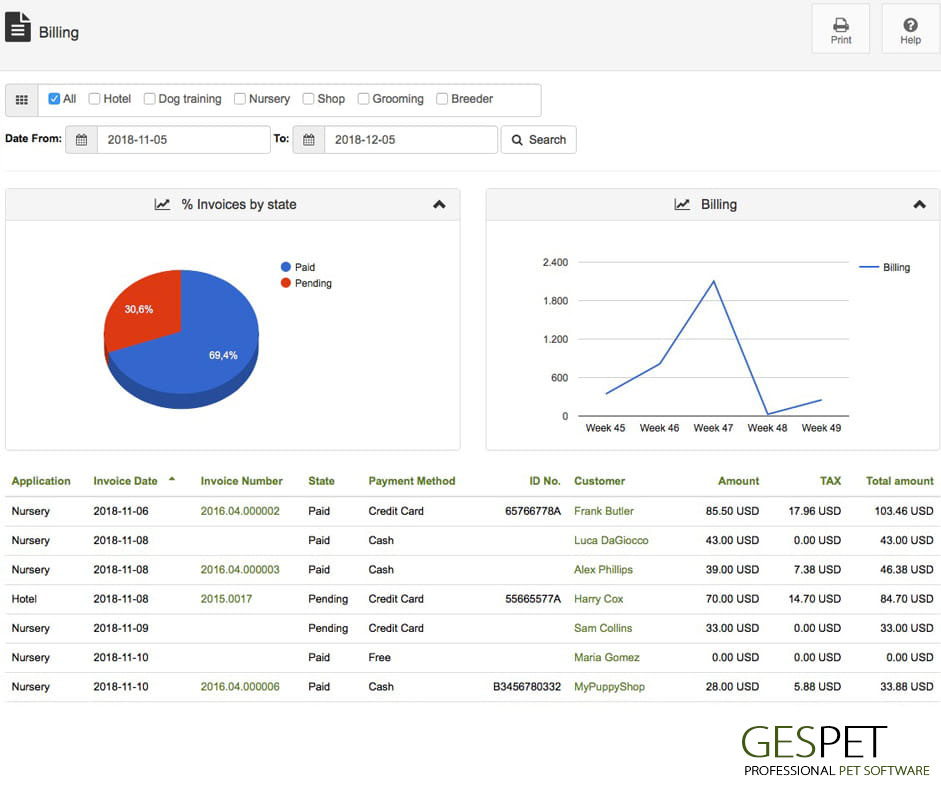
If the time period is short, the graph shows the evolution by week. Otherwise, it is displayed in months.
Since the main purpose of this report is to generate a list with information for paying
taxes, presenting documents for accounting, etc., it is not usual to generate it for more
than one year or for past years.
But, if you want to see all the billing details (for all the time you have been using the software, you can do so from the View > Sales option.
You can export this information in the Settings > Data management option.
List with all purchase and expense invoices in the date range and for the selected apps.
This report is useful for generating accounting/submitting documentation/tax payments, as it details the data for each invoice.
If you prefer to simply check the expenses (the money you have spent), without the complete details of the invoice, you will find the RESULTS report more useful.
DETAIL:The information included is:
Invoice date (does not have to be the same as the payment date)
Invoice number
The method of payment
The status: paid or pending
Supplier information: name and identification document
The base amount (or without taxes), the tax percentage and the final amount (or total)
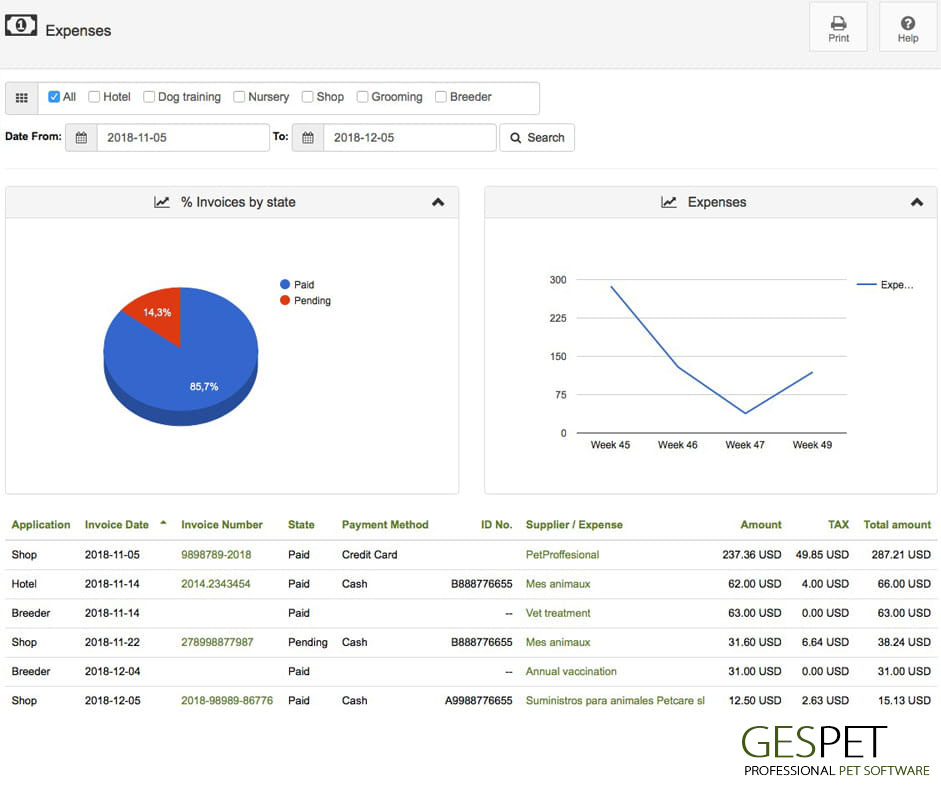
If the time period is short, the graph shows the evolution by week. Otherwise, it is displayed in months.
Since the main purpose of this report is to generate a list with information for paying
taxes, presenting documents for accounting, etc., it is not usual to generate it for more
than one year or for past years.
But, if you want to see all the details of expenses (for all the time you have been using the software, you can do so from the View > Expenses option.
You can export this information in the Settings > Data management option.
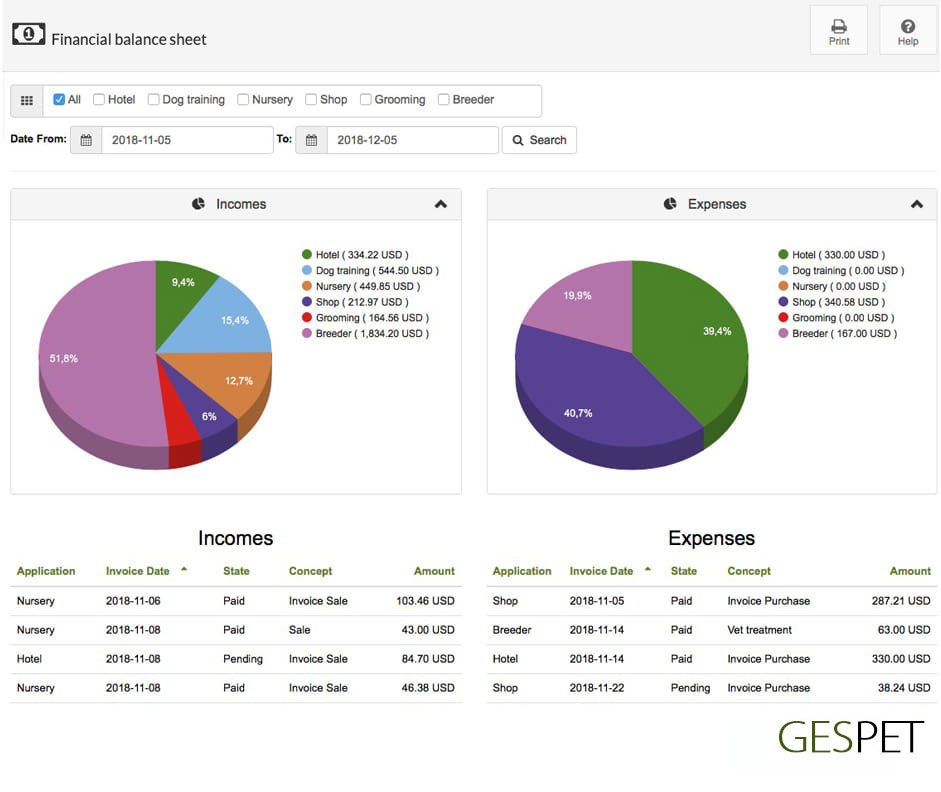
Allows you to quickly consult income, expenses and the result (difference between them).
It is very useful to know the income, expenses and/or profit in a range of dates, for all apps or by business areas.
To generate accounting/submit documentation/pay taxes, it will be more useful for you to use the BILLING and EXPENSES reports, as they detail the data of each invoice.
DETAIL: The information included is:
The business area (Hotel, grooming, petshop, ...)
Invoice date (does not have to be the same as the payment date)
The status: paid or pending
The concept or detail
The final or total amount (including taxes)
The bottom line (the difference between income and expenses)
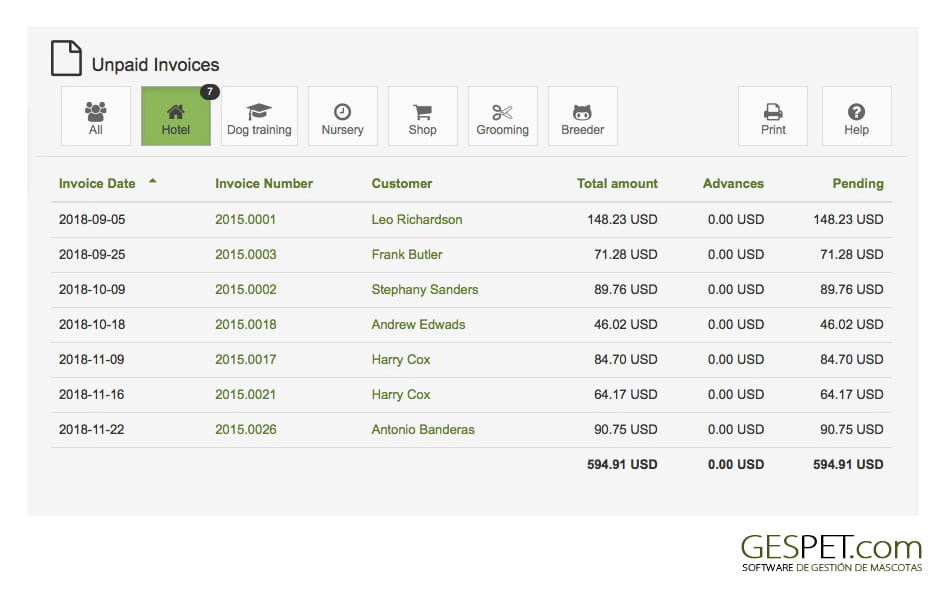
You can generate a report with invoices that have a status marked as "pending payment". The total amount, if you have paid advances, and the pending amount appear broken down.
The information included is:
Invoice date
The status of all of them is pending
The client
The final or total amount (including taxes)
The advances you have already paid
The money pending payment, that is, the total amount - the advances already paid
It is a report with all the clients of your business. The contact information of each client is shown, as well as the animals associated with them.
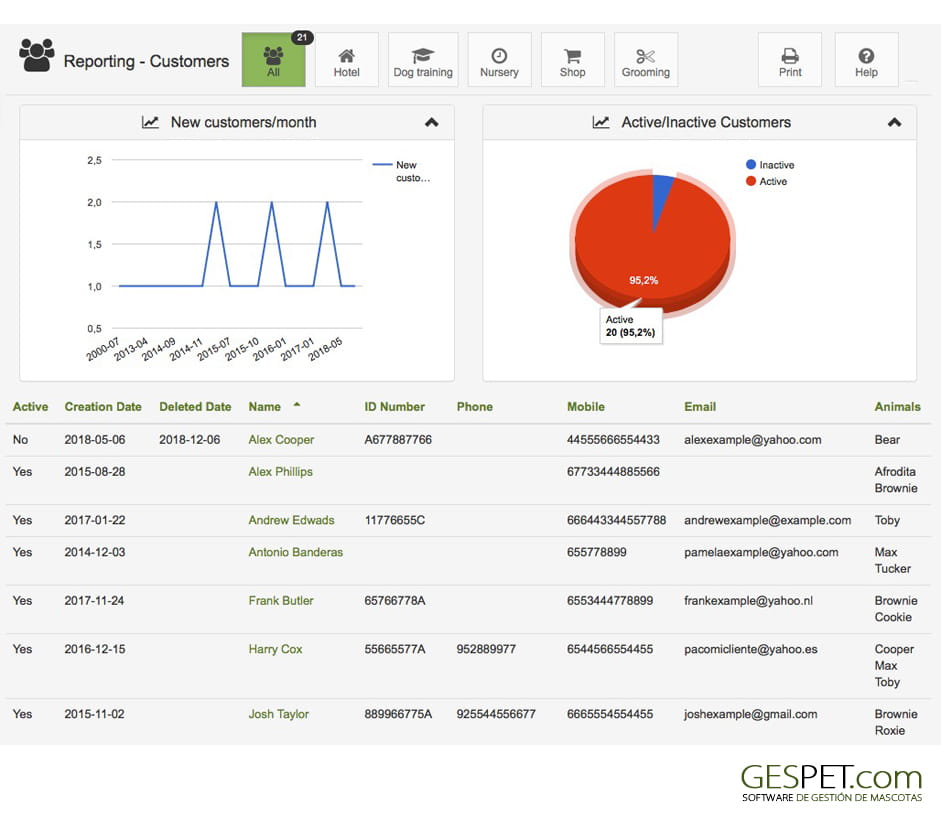
You can export this information in the Settings > Data management option. In the exported .xls document, the information also appears: WhatsApp
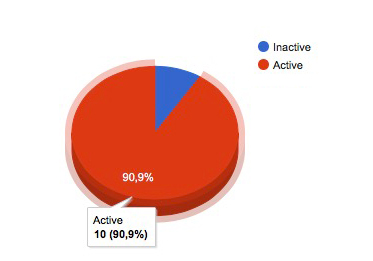
List of clients according to their profitability, that is, sample:
If it is active or inactive: (you can mark clients as inactive in their file)
The number of sales: that is, the number of services or products you have purchased
The money they have invoiced: that is, the money we have earned from that client
The last product or service they purchased.
TIP or TIP: So that you can visually quickly identify whether a lot or a little time has passed since the last sale made by that customer, we have incorporated some extra functionalities "the elapsed time indicator and identifying colors". For example, 10 months have passed since the last sale.
If you want to know which customers have not purchased any product for a long time, you can sort the last sale column and you will see it.
Report with the addresses of your clients, it is especially useful to know which areas/provinces/etc. where your clients reside and in this way, you will be able to make decisions more easily about advertising, collection and delivery routes, opening of new centers, etc.
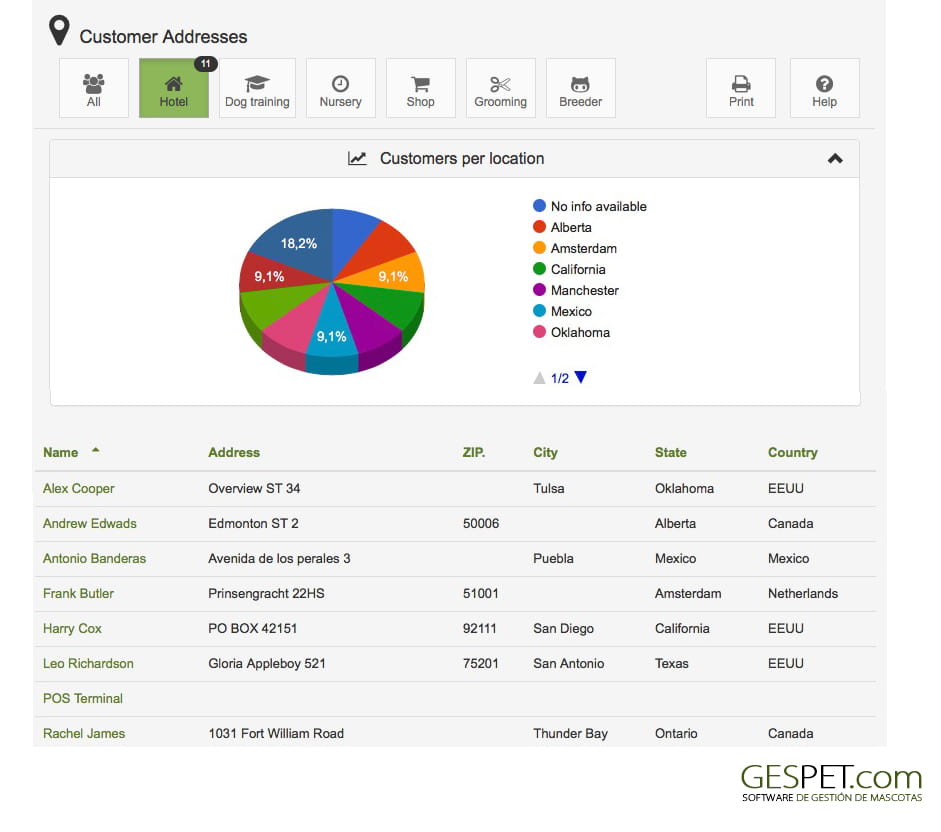
Puedes exportar esta información en la opción Configuración > Gestión de datos.
Shows the profitability of services and products. This is especially interesting for planning new services, offers and promotions among your customers.
This report shows:
The sales number of that product or service
The money that has been earned by selling that product or service
When the last sale was made
EXTRA: So that you can visually identify in a fast way if a lot or a little time has passed since the last sale of that product or service, we have incorporated some extra features "the indicator of elapsed time and identifying colors". For example, 10 months since the last sale.
The titles in the table allow you to sort by clicking on them:
For example, you can sort them by the money you have earned with that product from highest to lowest (or the other way around)
If you want to know which products or services have not been sold for a long time, you can order the last sale column and you will see it.
More information on ordering and search engines:
Click hereIf you click on its name, you can access directly the magic desk of the product.
Selecting a period of dates, shows the returns that have been made.
It includes graphs with the percentage of returns with respect to the sales of the same period and the 5 products that have been returned more times.
By clicking on the name of the customer, open a new tab of your browser with the magic desk (the home-page with all the customer'sinformation) of that customer. In the same way, when clicking on the invoice number, it opens in a new tab the detail of that invoice.
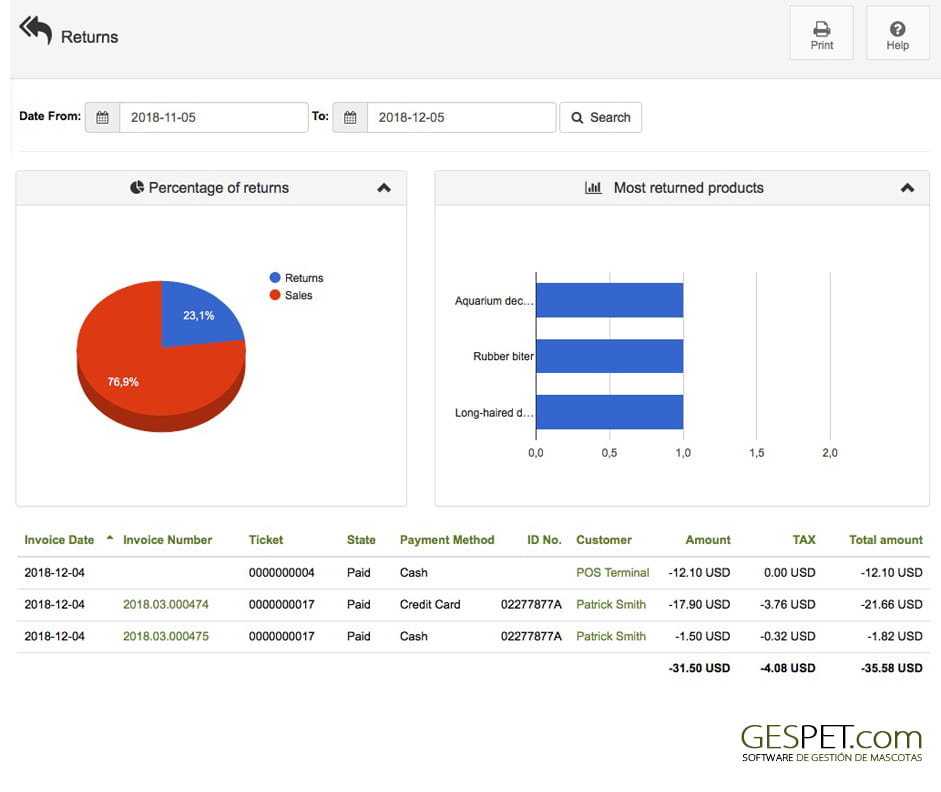
The titles of the table allow you to order if you click on them. For example, you can sort them by date, status, customer name, amount, etc.
We remind you that you will also see the returns in:
the Billing report, because they are "sales with a negative amount"
the Result report
the option View > Cash
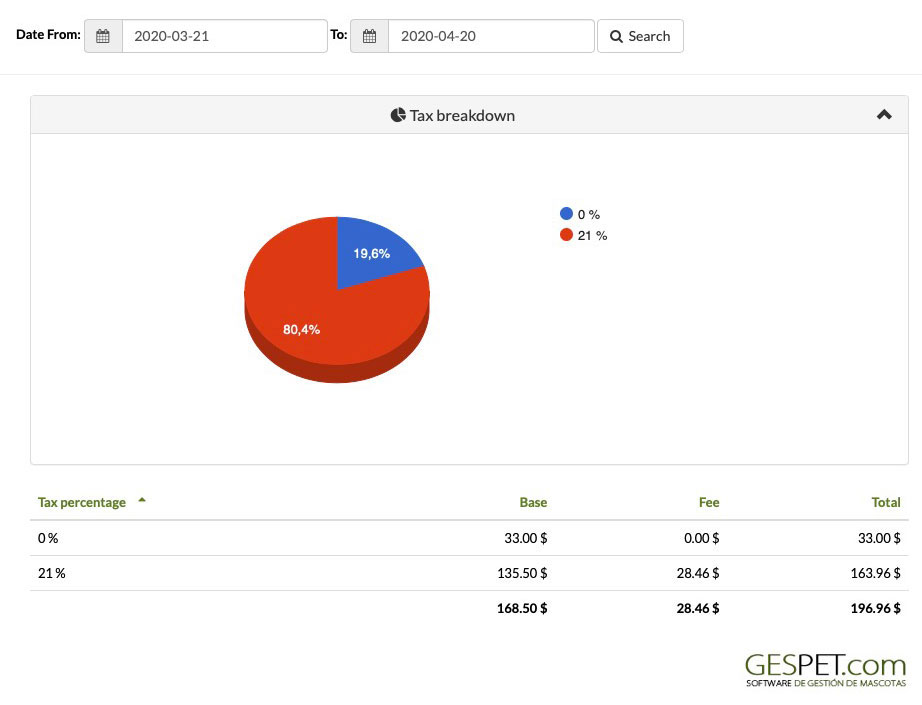
Shows a detailed breakdown of sales related to the shop module within a selected date range, grouped by tax rate.
If your shop sells products with different tax rates, this report is especially useful for accounting purposes and for submitting tax documentation and payments.
Its allows you to know in a quick way, how many products active you have, the availabre units of each product and the total number of units in stock of all the products of your business.
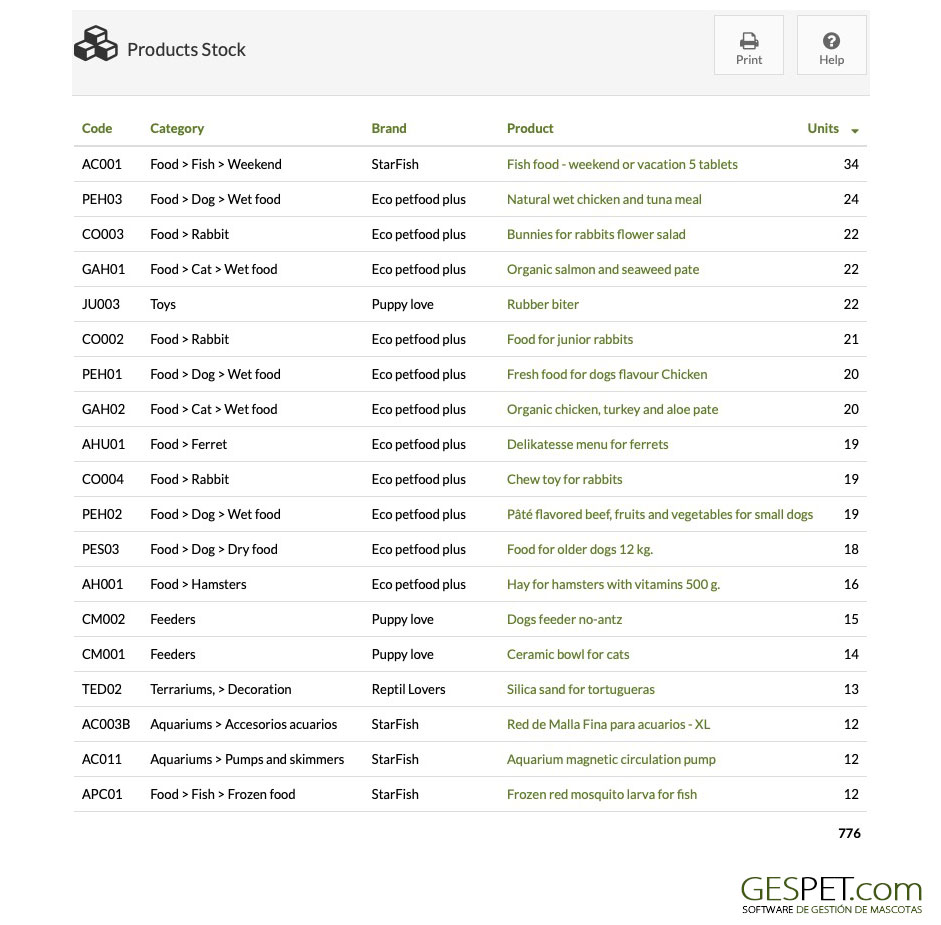
You can order by clicking on the header by: product code, category, brand, product or number of units. If you press once it is ordered in ascending order and if you press again it is ordered in descending order.
Clicking on the name of a product, the file of that product opens in a new tab of the web browser.
note: Only active products appear; If a product is deactivated, it will not appear in the report.

It allows you to quickly know an valuation of the active products:
The number of availables units of each product
The last purchase price of that product and the total (10 units purchased at $3 = $30)
The last sale price of that product and the total (10 units if sold at $6 = $60)
note: Prices are base prices, that is, prices without taxes.
You can order by clicking on the header by: product code, category, brand, product or number of units. If you press once it is ordered in ascending order and if you press again it is ordered in descending order.
Clicking on the name of a product, the file of that product opens in a new tab of the web browser.
note: Only active products appear; If a product is deactivated, it will not appear in the report.
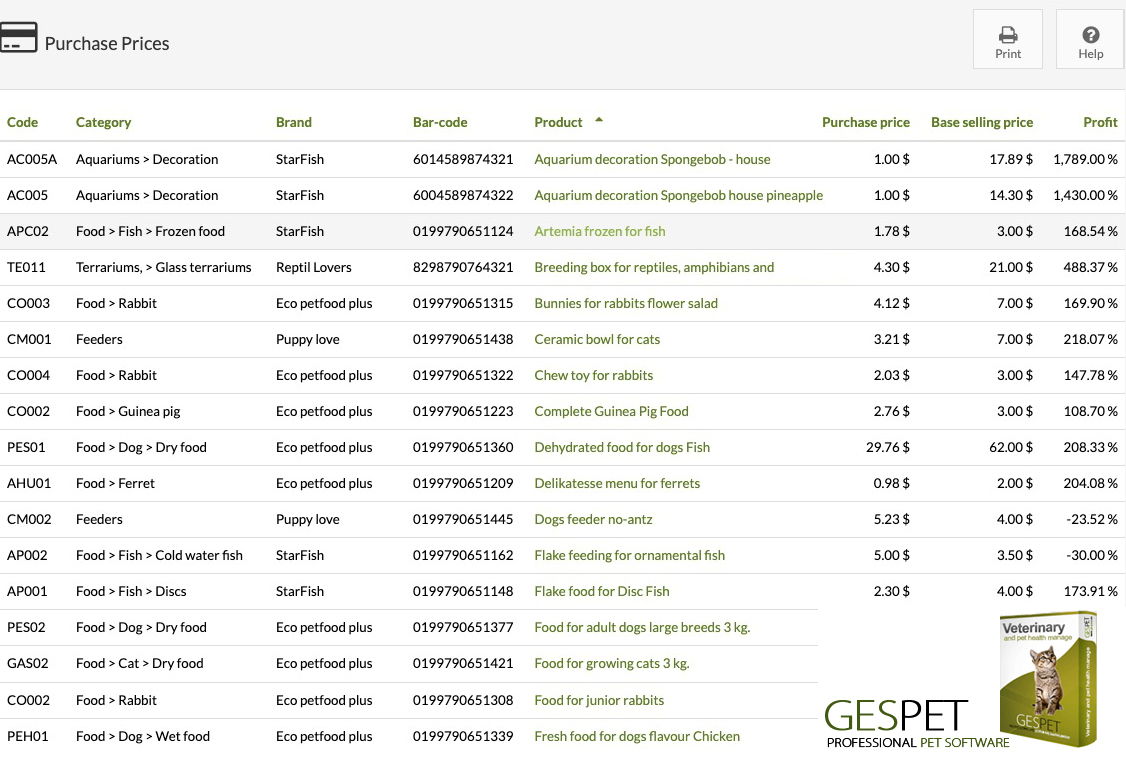
Displays all active products with the last base purchase price, last base selling price, and profit percentage (difference between the selling price and the purchase price) for each of them.
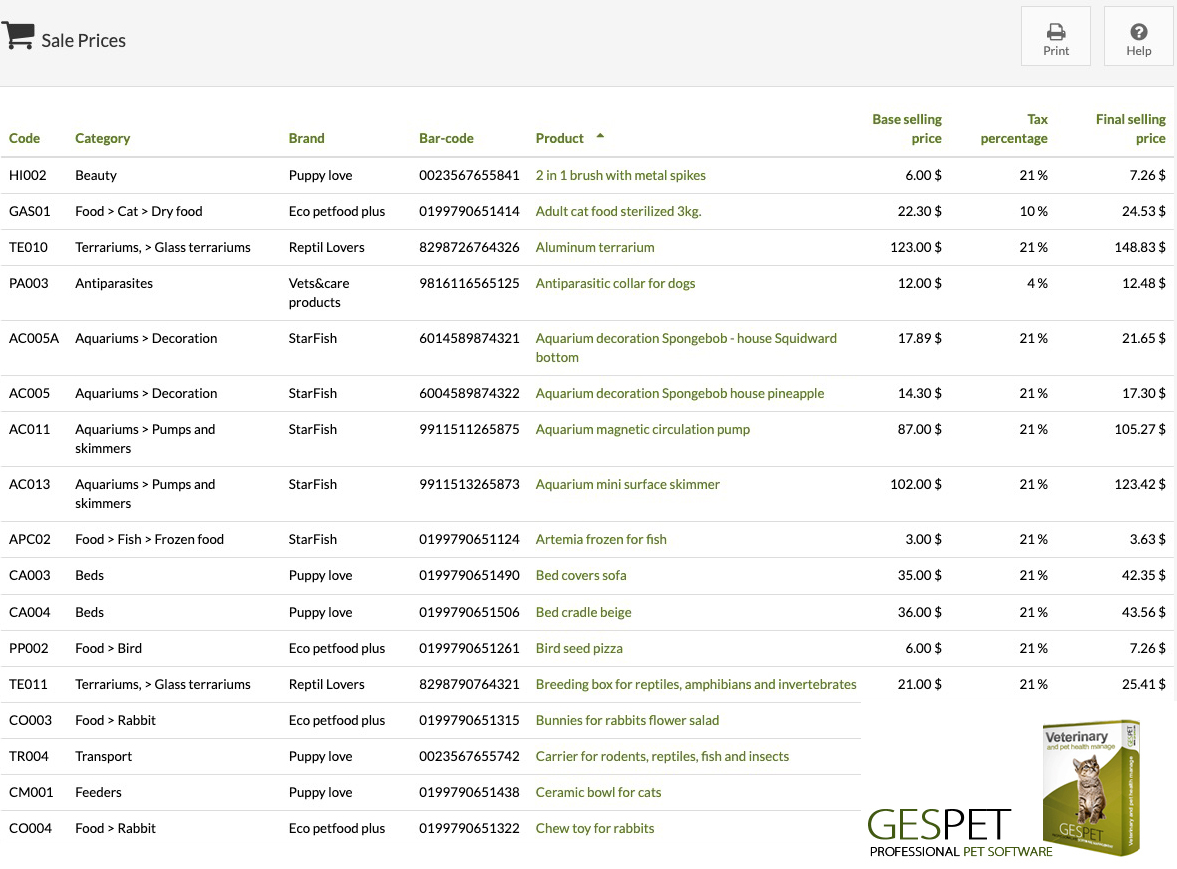
Displays all active products with the last base selling price, tax percentage, and final price for each of them.
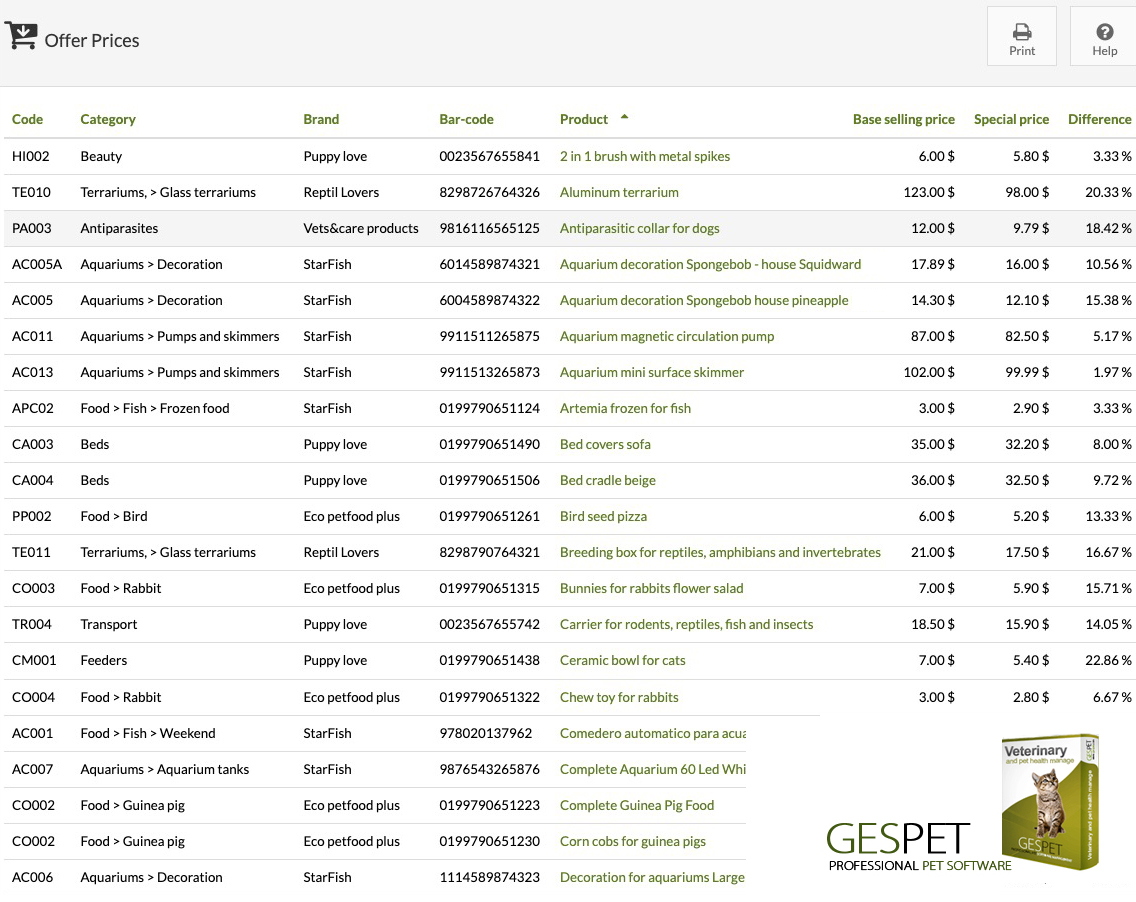
For Offer Prices, displays all active products with the last base purchase price, last base selling price, and profit percentage (difference between the selling price and the purchase price) for each of them.
The software includes multiple reports that will give you a lot of information about your business, customers, sales, profitability, animals, forecasts and more.
Include customization options, to make data filtering much more interesting. For example, in some you can select the date range, in others you can select the business areas, etc. This way you can adjust it to your needs. For example, you will be able to consult the billing of a quarter or see the clients only from the Hotel area.
QUESTION: Can I create custom reports, using these reports as a base?
Yes, of course. If you want to create a custom report by combining or consolidating several, you can do so. You just have to perform the search you want, copy the content and paste it into Excel/Numbers and here you can work with the information as you want.
For example:
In the option Settings > Data management > You can export the information of ANIMALS
Or in the Report > Animals > You can select the business area, sort the data as you like and select the information that is shown on the screen > Right button > Copy and paste it into your Excel/Numbers document (button right > paste)
In Excel/Numbers you can work with the information as you see fit: delete columns, sort, add more information, ...
You can also export another report, for example the customer report, the profitable animal report or the one you want and combine or consolidate them to create your custom reports.
QUESTION: How can I share the reports?
All reports include a Print option and clicking this Print option generates a .pdf file.
You can send it by email, copy it to a disk, save it on your device, upload it to the cloud
or whatever you need.
TAGS:
petshop reports | pet store free reports | petshop most profitable prodcuts | petstore most profitable prodcuts |pet shop unpaid invoices software | petshop reports app | pet store reports apps | animal store app | petshop tax breakdown report | pet store tax breakdown report | software animal store stock product | petshop stock report | petshop stock valuation | Pet Store stock valuation software | pet shop stock valuation app |